Many people want to know how much free electricity and income their home roof could generate if fitted with solar panels – if that includes you, then you’ve come to the right place.
First we’ll look at how much electricity you could generate, and then see what that’s worth in financial terms.
How Much Electricity Could My Roof Generate?
For a solar panel company to quote to a potential customer how much electricity solar panels could generate their is a complex legally set-down procedure to go through, for obvious consumer protection reasons. We can’t cover that here – but if you’re just at the stage of seeing if it could work for you at all, we’ll show how to get an indicative value.
To do this we’re going to use an EU website that has behind it a geographical solar generation database. When you specify your location and some basic details of a proposed solar array it can immediately look up how much average generation you can expect.

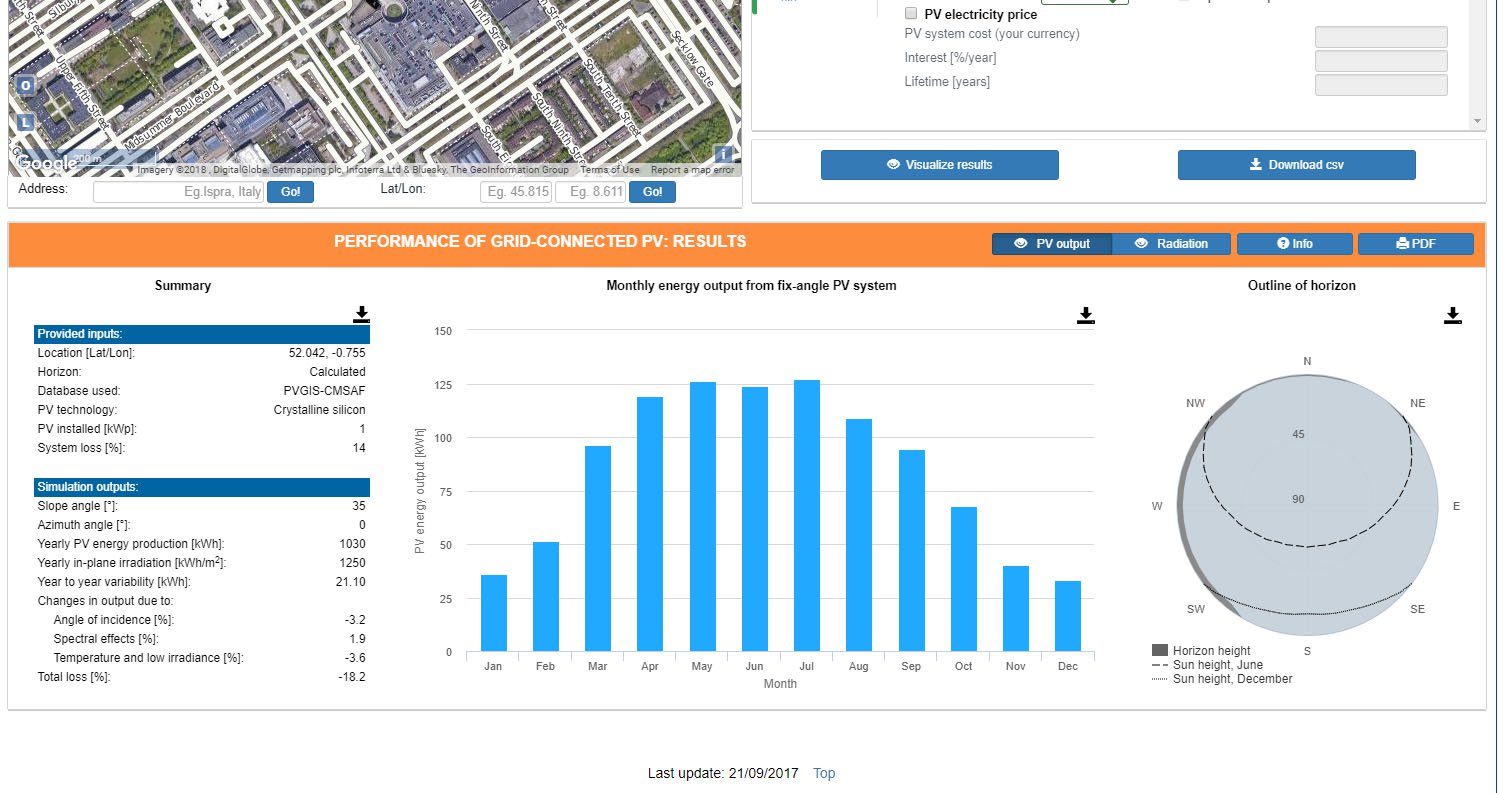
PV GIS website
This is the process – it’s quick and easy:
1. Go to the PV GIS site.
2. Bottom left, put your postcode in the Address box and hit Go! The map should now be centred on your area – if it doesn’t work, move the map with the mouse so it’s centred on your general location – and a number of defaults will have been set in the ‘PERFORMANCE OF GRID-CONNECTED PV’ area on the right.
3. Set the power of your preferred solar array in the Installed peak PV power [kWp] box (kWp simply means the peak amount of power in kiloWatts). In the UK a typical array will be 4 kWp, meaning it can generate a maximum of 4 kW on a perfect sunny day, so that’s a good figure to start with.
4. There’s just one more number you need to set, that’s Azimuth [°]. This is an angle that indicates how far your roof is pointed away from south. The default is zero, i.e. due south, but you should make a guess of what the angle actually is – say 20 degrees – bearing in mind that 20 means south-south-west whereas -20 means south-south-east. A good way to see your roof angle is to see it in Google Satellite view. You can even set the map on the left to give you this view (click on the icon top right in it).
5. When you’re ready click the Visualize results button.
6. You’ll see the results appear below the button. There’s lots of data here, but to keep things simple let’s just look at one figure – the amount of energy you’ll get in a year. That’s bottom left, under Simulation outputs, and it’s called Yearly PV energy production [kWh].

Solar generation results
I followed the above process putting in a central England (actually Milton Keynes) postcode, for a standard 4 kWp system facing south (zero Azimuth), and the result was 4110 kWh. Let’s call it 4000 kWh to keep the following sums easy.
How Much Money Could My Roof Make?
There are two elements to consider when working out how much solar generated electricity is worth: the savings on your bill and export payments.
Bill Savings
The biggest benefit financial benefit of solar is in reducing the amount of expensive grid electricity you need to buy. Exactly how much you’ll save obviously varies between households, depending particularly on how much you’re currently paying per unit, and how much you’re able to use the solar (if you’re out all day you’ll need to capture it in a battery to get the full benefit, for example).
Looking at round numbers, in an ideal situation, then 4000 kWh of solar electricity could save you 4000 units off your electricity bill. If you’re paying 15p/unit then you could save £600 per year if you used all the solar yourself. However, even with a battery, a figure of 70% is more likely so about £420 per year.
Export Payments
Since the start of 2020 there has been a scheme in place called the Smart Export Guarantee (SEG). Essentially you sign up to a particular tariff with an electricity supplier and they pay you a fixed rate for any solar generated electricity you export from your house to the national grid.
The rate paid varies so it’s worth shopping around, but 5p per kWh is fairly typical.
Given the 4000 kWh figure we got above, and assuming you export 30%, this means you’d expect to get an income of about £60 per year.
Total Savings
Combining savings and export payments means in this example the electricity generated is worth £480 per year. If you pay about £5000 for an installation then that’s a simple payback in just over 10 years even ignoring any annual increase in electricity costs. After that you get free electricity for the life of the equipment (typically 20-30 years for the panels).