After you’ve had a new solar and/or home battery system installed there can be a lot to take in. You will have the new equipment, with its screen and flashing lights, you will have a new online portal giving you tons of information and graphs, and you will have a shiny new app on your smartphone that you may be tempted to keep checking. It’s a recipe for information overload if you let it be, but in fact these systems generally look after themselves and you rarely need to intervene or change any settings.
We’ve written a few background blog posts that may be helpful to understand what’s going on:
- Watching my Home Generated Electricity Come In
- Do Home Battery Systems Work Automatically? and How Does a Home Battery System Work?
- Understanding the online data: Have You Optimised Your Battery Storage?
Armed with this knowledge it should not be daunting to check and understand how your system is working. With time it becomes natural to edit the online charts to show exactly what data you are interested in, and to hide the stuff that’s irrelevant.
Also, be aware of how different system modes interact. For example, if you set your system to charge up this will take precedence over any discharging: if you tell it to charge up in your cheap overnight period (e.g. Economy 7 set from midnight to 7am) it will not discharge at all during that period. So you may set it to charge to 50% and it achieves this by 2am, but if you get up at 6am and turn on the kettle the battery won’t discharge to power it (not until after 7am).
Notwithstanding these considerations, there are times when the system may appear to be telling you something is wrong, and that’s what we’ll look into here. This is typically in the form of alerts and warnings, or inconsistent data flow readings.
Alerts and Warnings
Most solar and battery inverters can raise alerts and warnings, and these will show typically on the inverter screen and on the online portal, and sometimes also on the app. Typically in software lots of things are flagged as warnings and alerts and the challenge is in getting the sensitivity right. Too many alerts give lots of false positives and too few give the opportunity not to spot problems. As a result most systems give too many errors and warning, so don’t panic if your system is showing alerts (and you may see that some had been there for a long time but you just hadn’t noticed).
Very often the system is working fine, and the alerts are unimportant. For example, one popular inverter gives a warning every time the batteries go ‘over voltage’ – but really this just means the batteries are fully charged, so you could see this warning every day. We’d suggest only if they don’t clear themselves after a few 24 hour cycles or if they are clearly very significant should they be taken as cause for concern.
Data Flow Anomalies
Very often when we look at the data that the system is presenting we see values that appear to be wrong and/or inconsistent with each other (for example the power being used and exported doesn’t add up to exactly the same figure as is being generated). There are two main reasons for this:
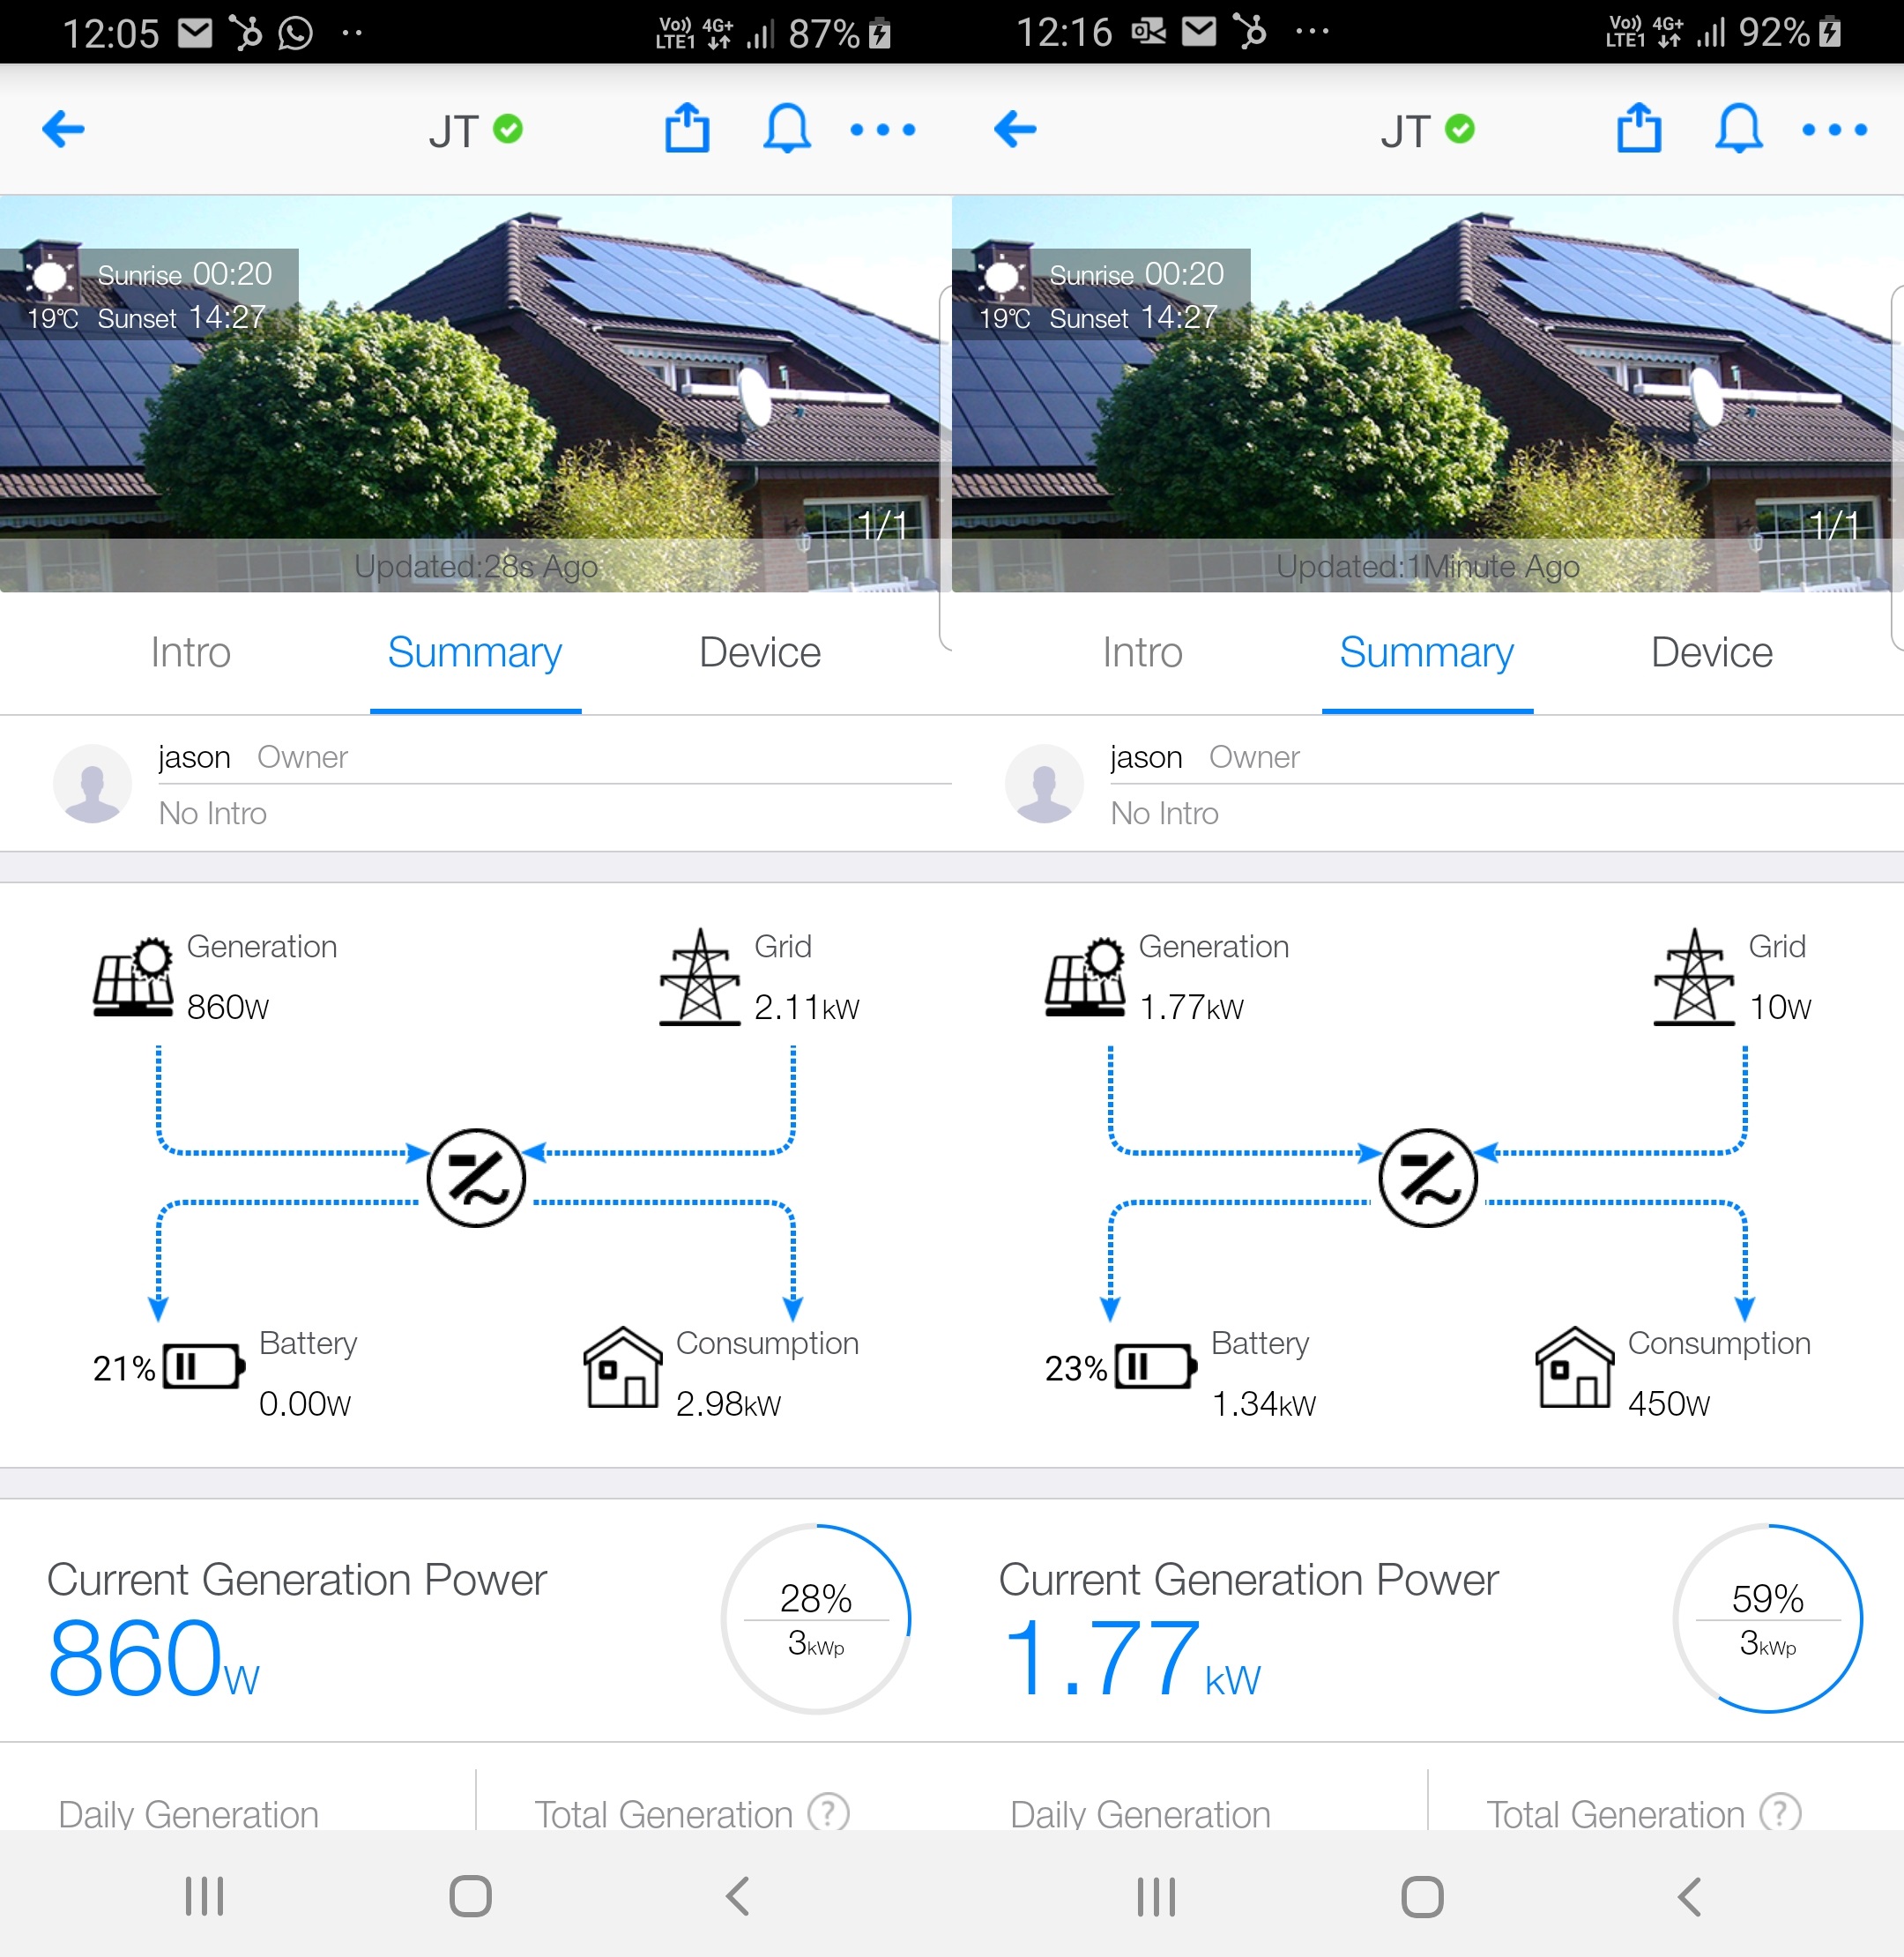
- Hysteresis: To avoid stressing components and switching on and off incessantly, there is a lag before the control system turns the batteries on and off. We don’t want to be switching to discharge for a short duration demand peak (e.g. a motor turns on) otherwise we may oversupply. Instead the system waits some time for changes in demand to stabilise. This will result in periods of time when the power flows are not going in the optimal direction. These periods are usually quite short. However, the data is only updating every few minutes so you will often get a snapshot that can be misleading; this is a particular issue on a phone app as it may appear to be exporting when it is actually just frozen in a moment of time.
- Error and precision: The components will have a certain level of accuracy and will be affected by other components around them so we would always expect some 10’s of Watts discrepancies. The sensors, for example, may only be accurate to about 50 Watts so we would disregard flows below about 100W as they are generally spurious readings and not important.
Therefore the best way to observe data is online on a computer to see graphs of the data and how it varies over time; this tends to give a more accurate picture overall. If you think you’ve seen an anomalous reading on your phone then it’s best to check the online portal for the same time, and you may see that any issues were fleeting and the system was simply in the middle of changing from one state to another (e.g. from charging to discharging).
If, however, you see readings that don’t look right, last for more than 5 minutes, and are greater than about 100W (0.1kW) then by all means raise a question to our Support team including screenshots from your online portal showing the issue and we will come back to you with an answer.
