[We have the pleasure to publish here an article from one of our customers, Peter Cittern, describing how his solar generation matched up to our predictions. He previously provided the article on Adding Another Battery to a PowerBanx Home Storage System]
As part of the pre-work to help decide on the number of batteries I was going to go for, Trevor at Fuel Included/Tanjent put together a model using my data. This data included my typical electric consumption and solar setup. The model uses my location (Bristol), the number of solar panels and their rating, how many panels point in which direction and their angle. The output is modelled for each month of the year.
For info, here is a photo of the house showing the panels. The roof ridge line between the two largest solar arrays points south.
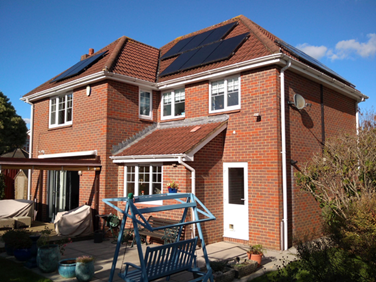
The arrangement of solar panels on my roof (Image: P. Cittern)
My solar has been up and running for 3 years and I had been compiling the data each month, so I thought it would be interesting to compare the actual data with the model. I’ve shown this as 2 graphs, the first shows the model as the orange line, then the individual years are shown 2018, 2019, 2020, then Jan 2021 is the pale green dot.
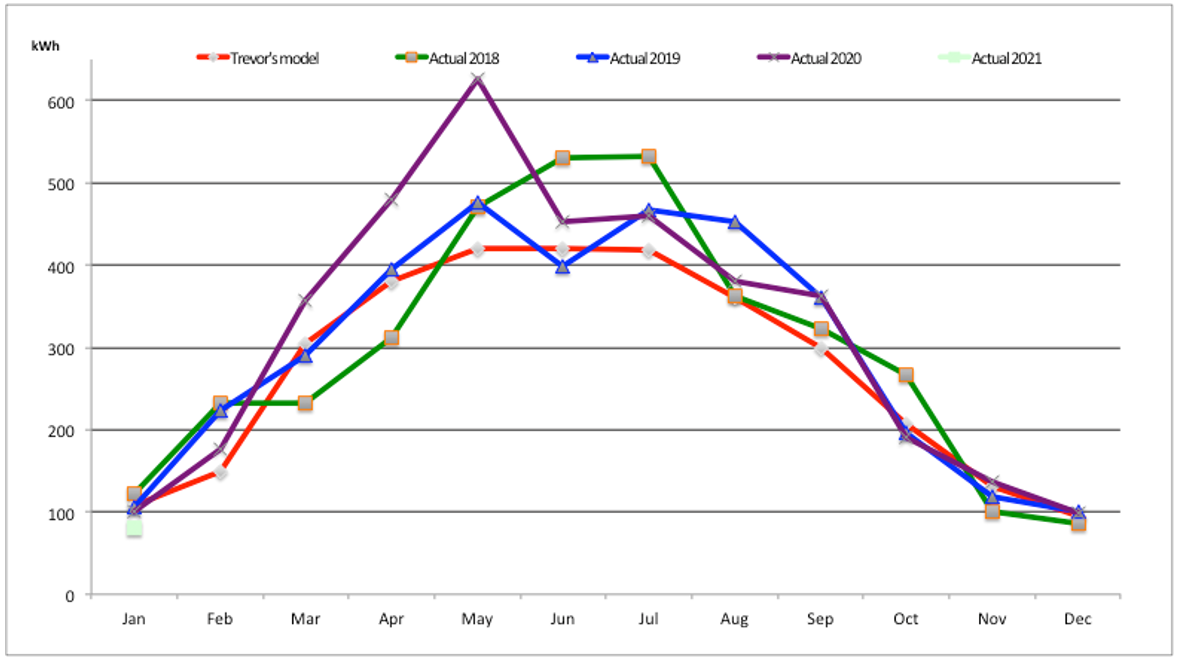
Solar Generation Per Year (Image: P. Cittern)
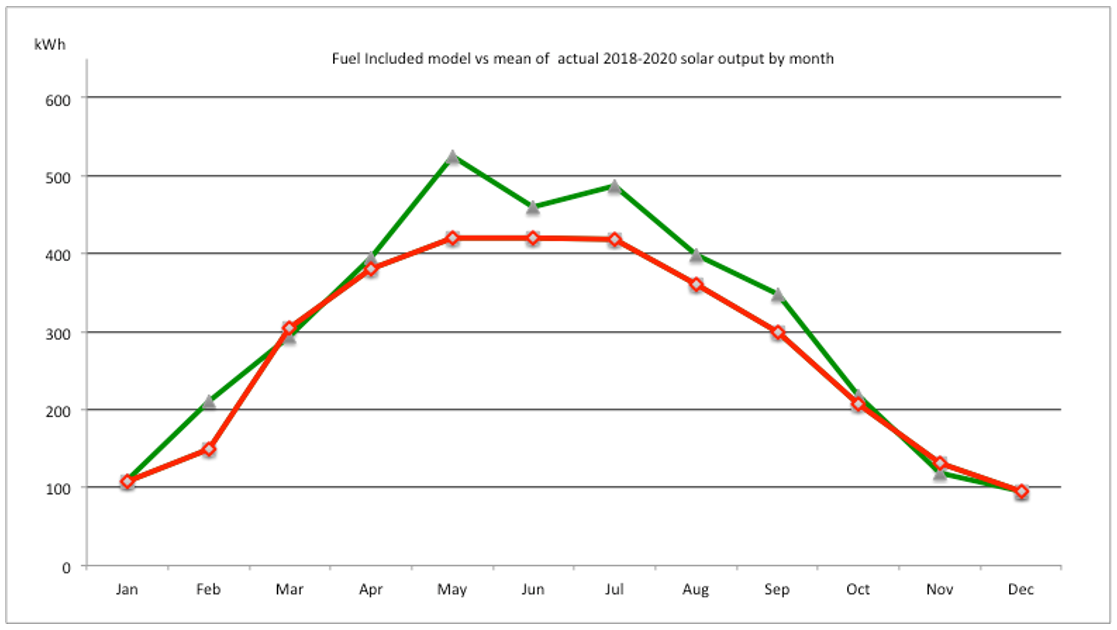
The second graph shows the model in orange then the mean of 2018-2020 in green.
Solar Generation vs Tanjent Model (Image: P. Cittern)
Note that 2020 had 2 exceptional months. April was the sunniest April on record, whereas May was the sunniest month on record (both for the UK). The average May data is skewed upwards by this record 2020 data whereas the April data seems not to be, as April 2020 and April 2018 seem to have effectively cancelled each other out.
In conclusion, it’s good to know that the model is very close to reality.
The average output in the summer seems to be slightly greater than the model whereas at the other times of the year the actual and the model are very close.
Pete Cittern, 4 February 2021