We are frequently asked about the impact of orientation on a solar installation. What is remarkable is how much you can generate, even when you are facing in the ‘wrong’ direction. Here we have some data to show you how much…
Daily Cycles
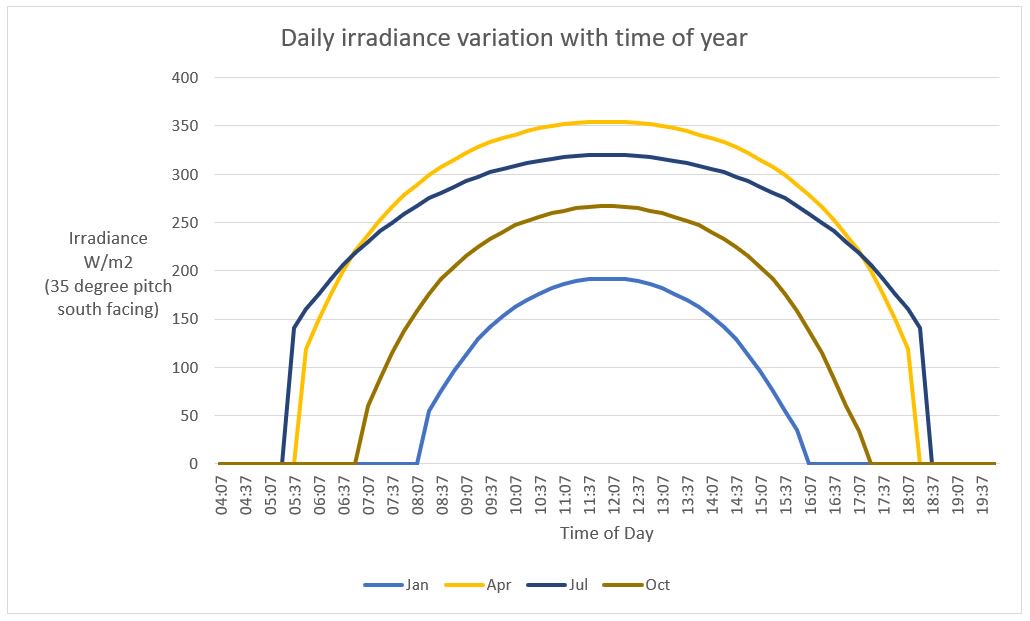
Each day the sun rises and sets with the day’s length and the height of the sun varying with time of year. This graph shows the variation of the solar irradiance* during the course of the day for four different times of year.

The shape is pretty consistent, but with the peak values in summer almost double that in winter.
Another consideration is shading. Objects above the horizon surrounding your solar array are going to have a bigger impact in winter than in summer as the sun does not rise so high. Luckily, you will therefore lose less energy overall as the generation is less in winter than in summer. Our shading calculations take this into account.
Yearly Cycles
The annual cycle is concerned with how much energy we generate overall. This governs your FIT tariff payments, and how much energy is available in your home.
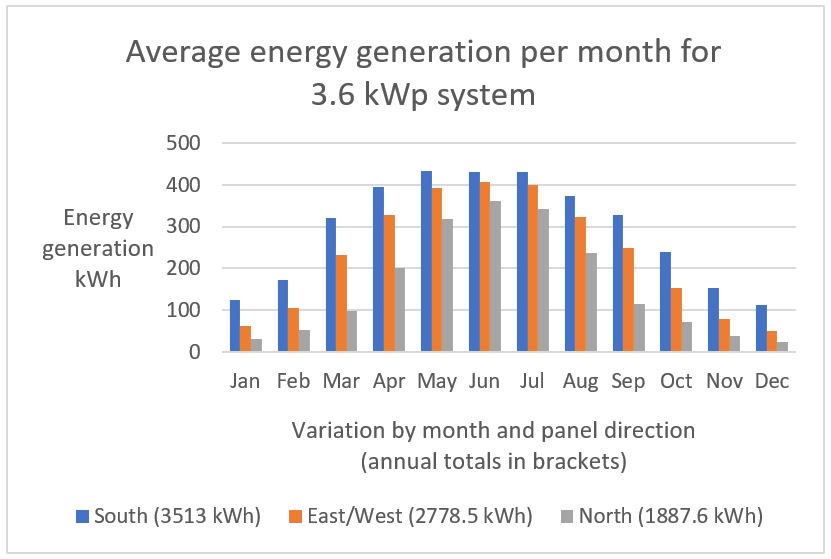
This graph shows how the generation varies by month for different orientations of the solar array*.

What is fascinating for me is that in the summer, there is so little difference between the North facing and South facing generation, with the north facing panels providing 85% of the amount the south facing system will provide.
Over the course of the whole year the relative outputs are:
- East or West facing panels create 79% of a full south facing system
- North facing panels create 54% of a full south facing system
What it means
This data is a reminder that even if you are not purely South facing, very significant power can be generated by panels on one or more roofs facing in other directions. To find out what your roof will give you, simply ask for a quote.
* The example given uses data from the European PVGIS information service. The example shows a 3.6 kWp system set at a 35 degree pitch, with 14% system losses. It is a roof mounted Crystalline Siliconsystem, and uses the Climate-SAF PVGIS radiation database.


