My experience on Day 1 with a PowerBanx home battery showed that it’s perfectly possible to run a house with using any grid electricity, i.e. for free. However, my experiences on Day 2 and Day 3 showed that it was quite hard to also charge an electric car for free with the same system – perhaps that was just too ambitious.
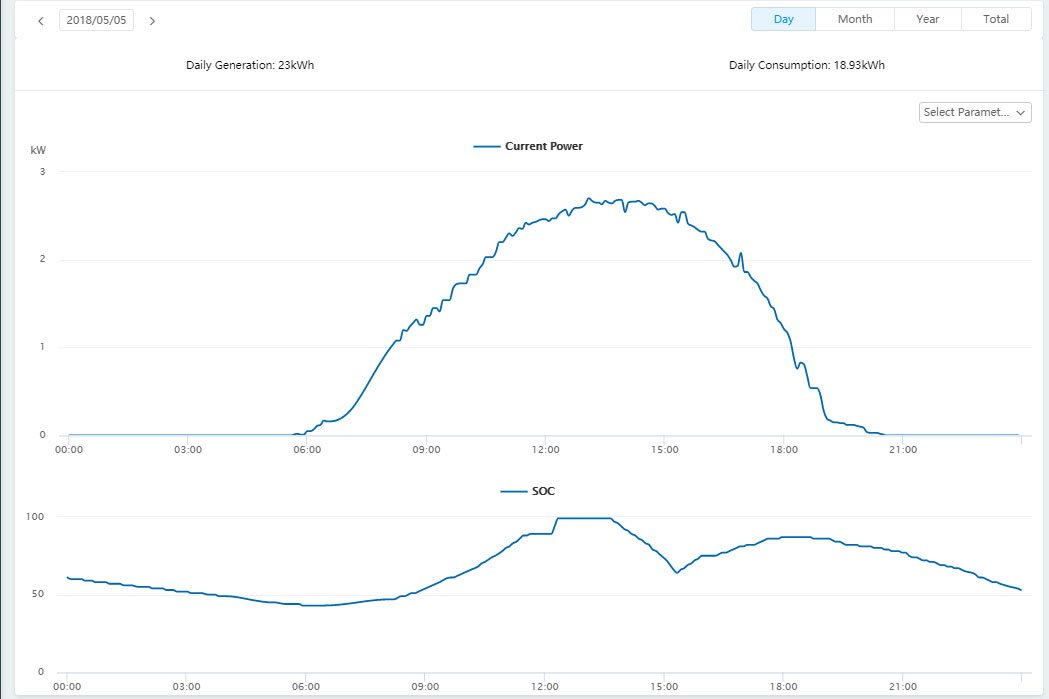
Anyway, on Day 5 it was so sunny that the PowerBanx battery was full soon after noon. As it continued to be sunny through the afternoon I was able to charge the car for two hours and still leave plenty of charge in the battery to run the house until the next day. We can see this in the charts for the day:

The solar generation (‘Current Power’) shows a remarkably ‘ideal’ curve going through the day, so clearly there was very little cloud or anything else to interrupt it. The battery charge level (‘SOC’ or state of charge’) can be seen to come through from the previous day at quite a high level, so no grid electricity needed to be used at all in the morning. It then dips down between 1300 and 1500 as the car is charged, but then goes back up again because the sunshine continues. It stays high enough through the evening that again no mains electricity is used. This is despite the fact that a PC was set running mining for Bitcoin through the evening to use up some of the spare electricity (and generated about 31p worth).
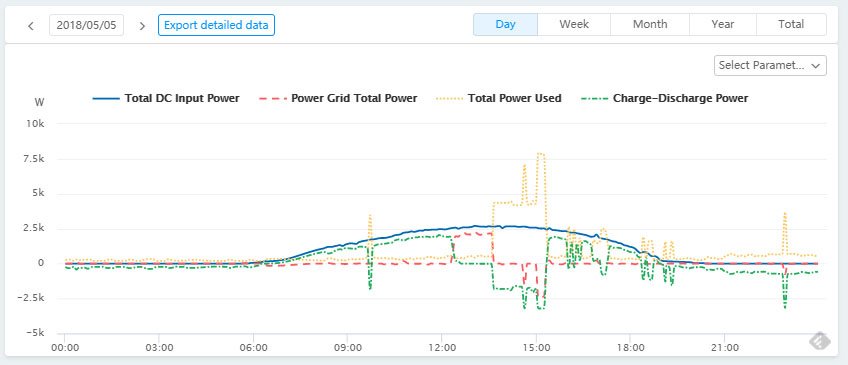
Using the SolarMAN Pro software we can actually drill down a bit deeper into what’s happening. Here’s a chart covering the same period:

The blue curve is again the solar generation (here ‘Total DC Input Power’) . The yellow line (‘Total Power Used’) is the house consumption, mostly low during the day but with a big jump as the electric car is charged between about 1300 and 1500. The green line (‘Charge-Discharge Power’) is the battery filling (above the 0 axis) and emptying (below the 0 axis). The red line (‘Power Grid Total Power’) is mains or grid electricity (being used below the 0 axis and being exported above the 0 axis).
We can see that most of the time the battery is filling from the solar but whenever there is a high demand for electricity shown by yellow spikes above the line the battery empties to try to keep the mains electricity from being used (i.e. to prevent the red line falling below the axis). Occasionally the red line does still go below the axis for a short time when the power demand can’t be met – such as when the lunchtime spike goes above the 5k mark. This is when the car was charging and likely indicates that some other high power device also went on at the same time, perhaps the electric oven.
Overall it is clear that the system is doing a good job of minimizing any usage of mains power from the grid, as the red line rarely drops below the axis. Checking the meters the next morning showed readings of 63266 (daytime) and 24867 (Economy 7), just one above the previous day, and the same as the previous day, respectively.
Therefore we know that 24 hours of electricity for the house, plus a couple of hours charging the electric car, cost about 15p.
Summary
Electricity costs for the house so far:
- Day 1: 0
- Day 2: 60p (caused by car charging)
- Day 3: 23p (caused by car charging)
- Day 4: 0
- Day 5: 15p (caused by car charging, and not counting 31p earned from Bitcoin mining)
- Average cost per day: 19.6p
Update: Days 6 and 7 and First Week Summary
Get The Right PowerBanx For Your Home
If you would like to know more about the PowerBanx range of home battery systems, and get a free instant quote, please complete our online form:


